A supplier quotes 85% brightness uniformity. Another quotes 90%. Before treating the second sample as better, ask what each percentage divides by—and where the measurements were taken. Two percentages can describe different calculations, even when they start with identical readings.
For an OEM brand or distributor, the useful deliverable is a reproducible record: the measurement quantity, a location map, the raw values, the calculation and the sample configuration. That record helps you compare proposals and investigate a later change without turning one demonstration into a promise for every production unit.
What brightness uniformity tells an OEM buyer
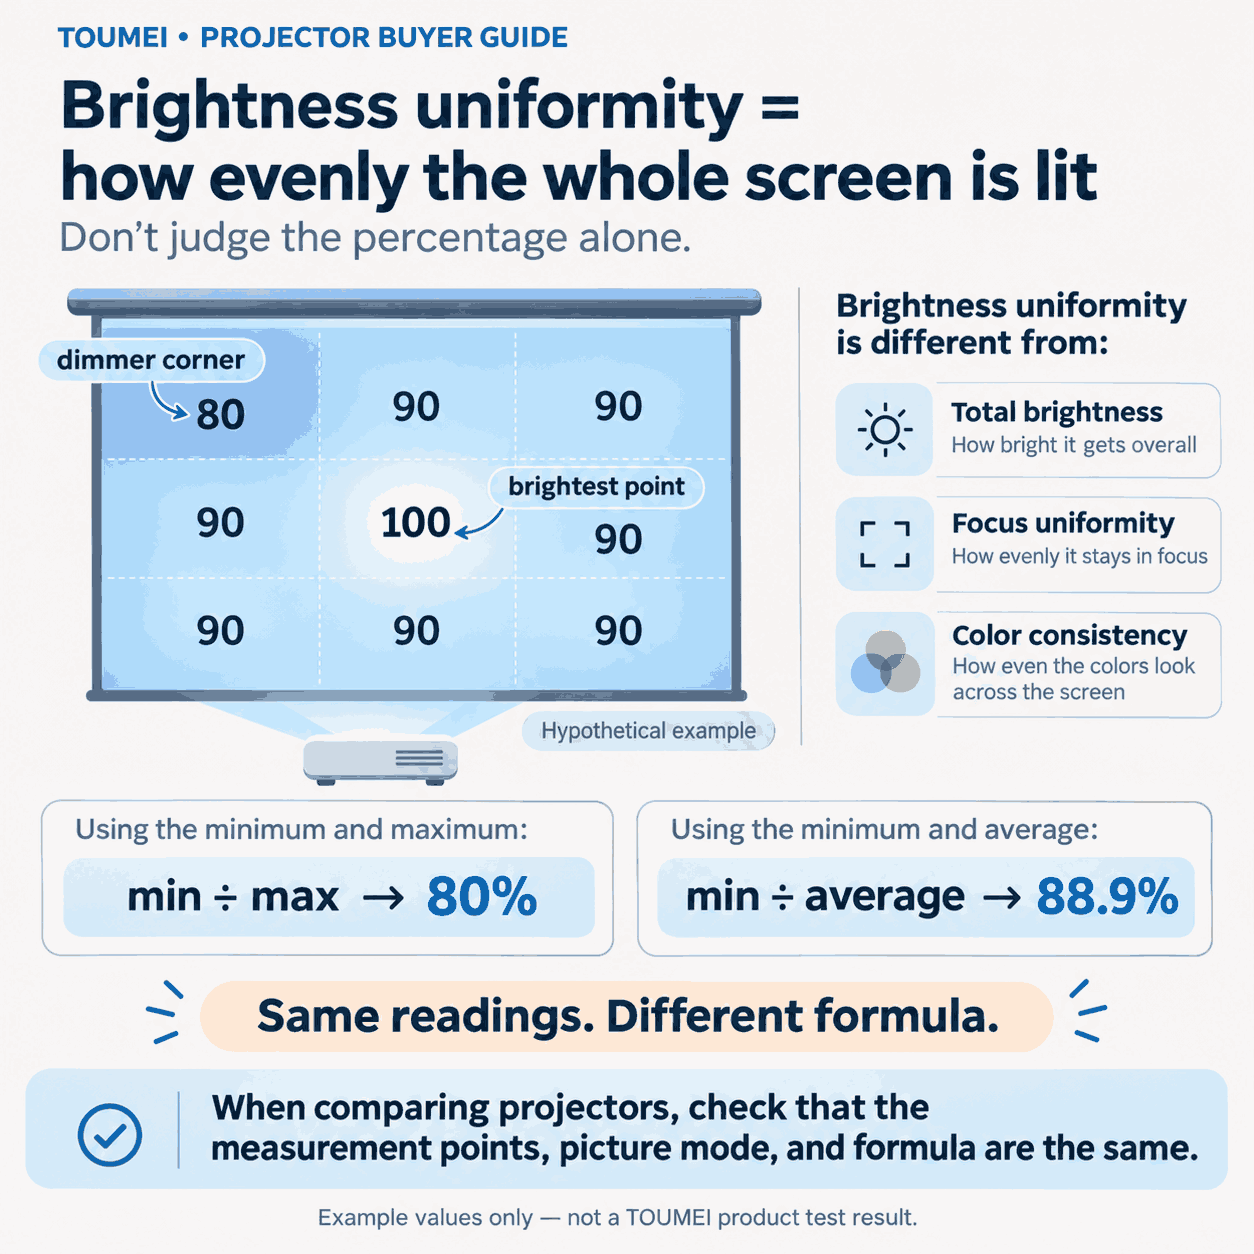
Brightness uniformity describes how light varies across the projected image. It is separate from total light output, focus uniformity and color consistency. A sharp corner can still be dimmer than the center. A bright projector can still have an uneven field.
The optical-module application note DLPA078C describes a white-field, nine-point illuminance example in its brightness-uniformity section. It discusses focus uniformity separately. That is useful technical context, not proof that a supplied projector was tested using that procedure or passed a particular threshold. [1]
For total-output terminology, see TOUMEI's projector brightness and ANSI lumens guide. Keep that discussion separate from the spatial comparison here.
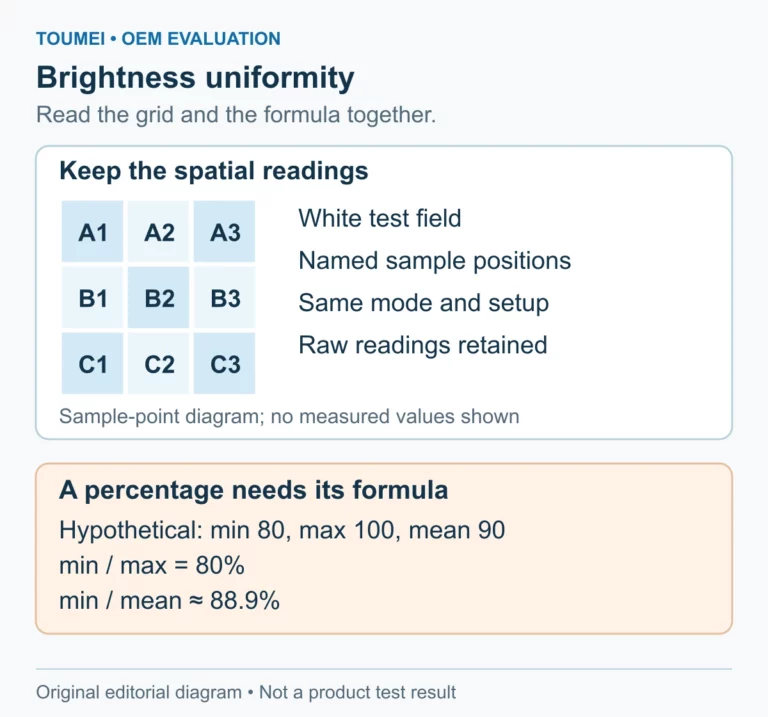
Keep the locations attached to the readings
A list of nine numbers without a map leaves an avoidable gap. You cannot tell whether the lowest reading belongs to a corner, an edge or the center. Ask the supplier to label each position and describe its coordinates relative to the active image.
Use a consistent orientation. “Top left” should mean the top left of the viewed image, with the projector's installation orientation recorded separately. State the measurement plane, instrument orientation and whether the values are incident illuminance in lux or reflected luminance in cd/m². Do not mix the two quantities in one calculation.
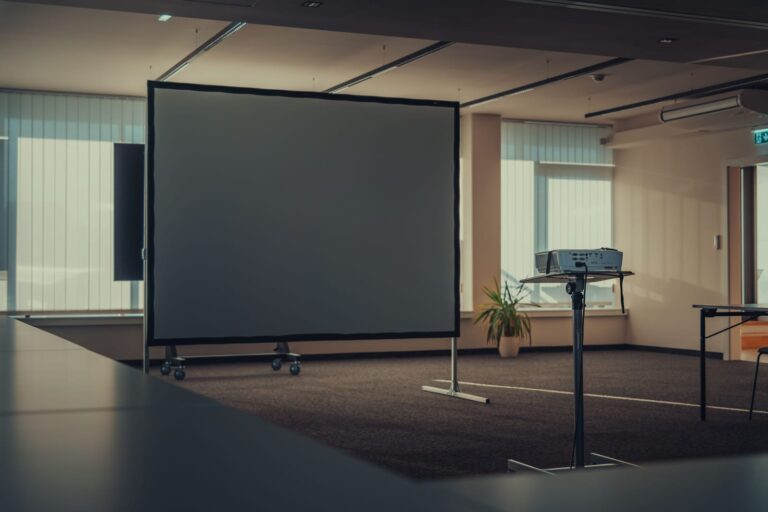
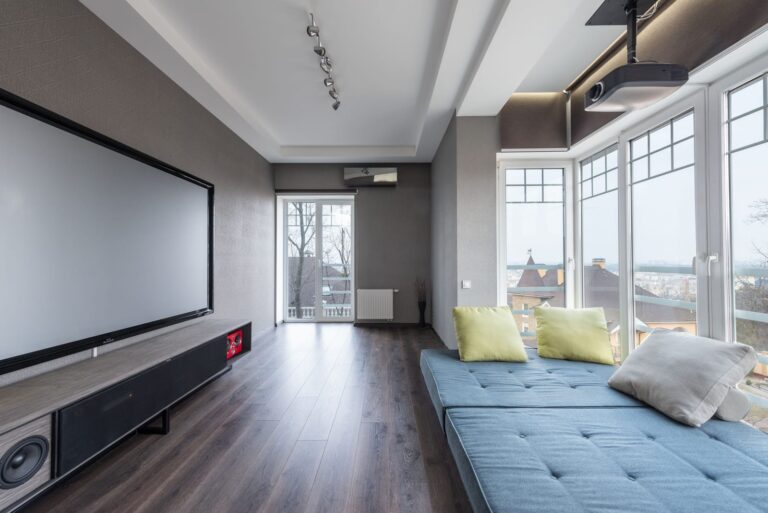
An image of the setup helps identify the screen and geometry, while the numeric file preserves the readings. A photograph alone is unsuitable for reconstructing a uniformity result: exposure and image processing can change how the field looks.
A percentage depends on its denominator
Here is a deliberately hypothetical worksheet. It is an arithmetic illustration, not a TOUMEI measurement, product specification or acceptance standard. The readings use lux solely to keep all entries in the same quantity.
| Position | Left | Center | Right |
|---|---|---|---|
| Top | A1: 80 | A2: 90 | A3: 90 |
| Middle | B1: 90 | B2: 100 | B3: 90 |
| Bottom | C1: 90 | C2: 90 | C3: 90 |
The minimum is 80 lux, the maximum is 100 lux and the nine-point mean is 90 lux.
- With an explicitly defined minimum/maximum calculation: 80 ÷ 100 × 100 = 80%.
- With an explicitly defined minimum/mean calculation: 80 ÷ 90 × 100 ≈ 88.9%.
Neither number changes the underlying map. They answer different mathematical questions. A supplier report using one calculation should not be ranked against a report using the other. These two formulas are shown to explain comparison risk; this article does not establish either as a universal method.
Build an acceptance record before comparing samples
The following worksheet is a procurement tool. Fill it with the supplier and the person responsible for sample approval before deciding whether a result is acceptable.
| Record | What to request | Decision it enables |
|---|---|---|
| Intended use | Spreadsheet, presentation, video or other representative content | Select the visual material used alongside the measurements |
| Measurement definition | Quantity, unit, point coordinates and exact formula | Recalculate the percentage and compare like with like |
| Configuration | Sample ID, firmware, picture mode and light-output setting | Identify which delivered configuration the result covers |
| Geometry | Active image size, distance, zoom if available, alignment and correction settings | Reproduce the arrangement rather than compare different setups |
| Environment | Ambient-light conditions, surface, instrument and stabilization approach | Identify uncontrolled differences between reports |
| Raw evidence | Point readings, location map, setup photo and report date | Investigate a dark region or a later sample change |
| Acceptance basis | Agreed target, its source, repeat checks and decision owner | Separate a project requirement from an unsupported industry claim |
Do not choose a universal pass percentage from this worksheet. Agree the relevant method and target for the application, then evaluate the result against that agreement. If the supplier cannot provide the calculation, keep the comparison unresolved instead of filling the gap with an assumed formula.
Investigate a difference without guessing its cause
Start by checking whether the reports describe the same configuration and measurement setup. If they do not, request a matched comparison. If they do, look at the location map: a single low region calls for a different investigation from a broadly darker perimeter.
Ask for a repeat using the agreed procedure before naming an optical defect. Changes in position, processing settings or measurement geometry can complicate a comparison. Preserve the original readings and record what changed between attempts.
Keep the application check separate, too. Review the actual presentation or video at the intended image size, and record whether any unevenness interferes with the buyer's use. This does not replace the measurements; it explains why the agreed acceptance target matters.
Frequently Asked Questions
Does higher total brightness prove better uniformity?
No. Total output and spatial distribution are different properties. Ask for a point map and a defined uniformity calculation in addition to the total-output report.
Can I compare two reports that both say 90%?
Only after checking the quantity, locations, formula and conditions. Matching percentages can come from different denominators or sampling layouts.
Is a nine-point map always the required method?
No universal requirement is established here. The cited application note provides a nine-point optical-module example. Follow the method agreed for the product evaluation and retain its source and version.
Can a phone photo verify the uniformity percentage?
No. It can document the arrangement or visible symptom, but camera processing and exposure prevent it from replacing the declared instrument readings and calculation.
Should corner sharpness be included in the same score?
Keep it separate. A focus check describes detail reproduction; the light readings describe spatial photometric variation. Separate records make a failed comparison easier to investigate.
What should an OEM buyer do when the formula is missing?
Request the exact formula and raw location readings before approving a comparative claim. If they are unavailable, mark that claim unverified and agree a reproducible evaluation before sample approval.
Discuss a measurable sample requirement with TOUMEI
Bring your intended content, image size, installation arrangement and proposed measurement worksheet. Contact TOUMEI about OEM/ODM samples to discuss the selected configuration and the evidence needed for your project. The result should be an agreed evaluation scope, with measured findings distinguished from proposed requirements.
References
[1] Optical module specifications, DLPA078C, revision October 2024, section 3.1 and section 3.2; accessed November 9, 2026. Supports spatial uniformity terminology and the separation from focus. This application note is not a test report for a TOUMEI model or a universal procurement threshold. The worksheet and arithmetic examples above are original editorial tools.